Ohio State Sports Analytics Conference – Student Presentation-Poster
Ágúst Pálmason Morthens1, Sebastian Levander2, Tim Keller3
1 KTH Royal Institute of Technology, Sweden
2 University of Gothenburg, Sweden
3 University of Basel, Switzerland
Introduction
As part of the group project in the “Mathematical Modelling of Football” course at Uppsala University in Sweden, we developed a metric to analyze the defensive part of Soccer.
Mistakes made by players positioned close to their own goal can be very costly in football.
The player can have an overall excellent performance but still cost the team the win with a single mistake.
Therefore we have decided to create a metric that can identify center backs that consistently make few mistakes.
We developed the metric dxT failed marking. Which quantifies the danger of successful passes and assigns that value to the defender closest to the receiver of that pass.
In this project, we used Opta event data and SkillCorner freeze frames of the 2020/21 Premier League season.
Metric
The first step in the metric is to take all successful open-play passes and evaluate how dangerous they are.
This is done by adjusting a position-based expected threat model (Singh 2018),
xT, which identifies dangerous zones on the pitch purely by location, with a pitch control model.
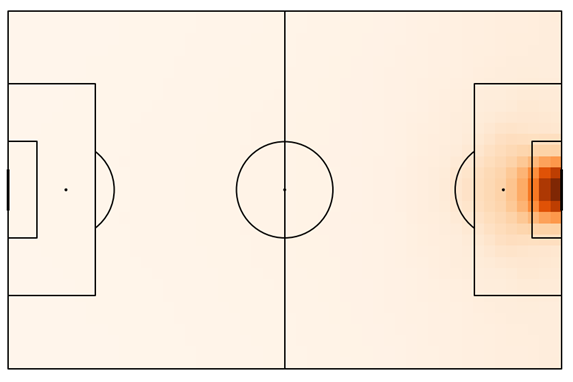
Figure 1: Expected Threat quantifies the probability of scoring a goal in the next six actions for every square on a grid of the field.
The pitch control model identifies what regions of the pitch are in control of each team (Spearman 2018).
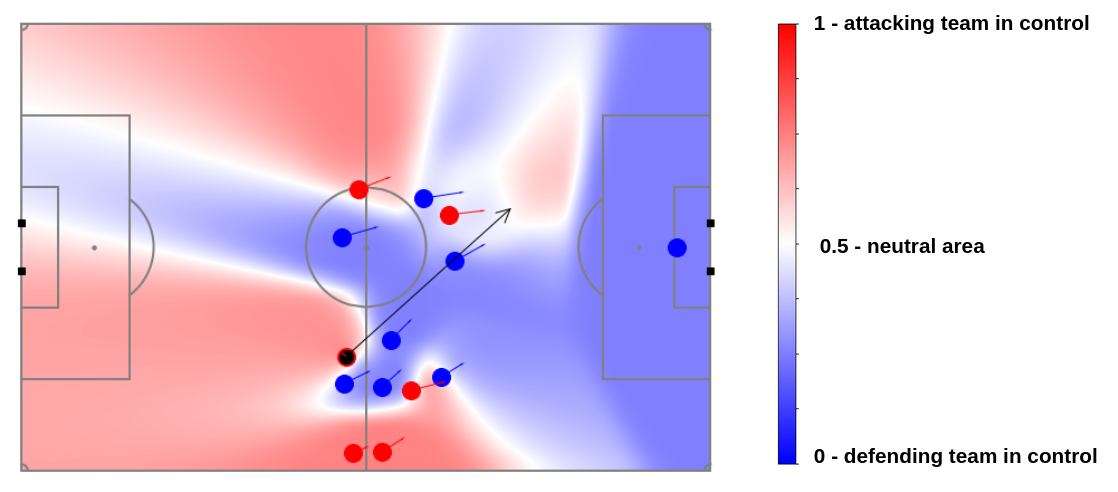
Figure 2: Pitch control quantifies which spaces are controlled by each team by probability of reaching it first.
Therefore, the adjusted xT doesn’t only consider the location of the pass, but also the location of the players on the field.
The danger of the pass, dxT, is then quantified by taking the difference of the adjusted xT value at the start and end location of the pass.
Thus, if a defender is well positioned relative to an attacker, he decreases the danger of the situation.
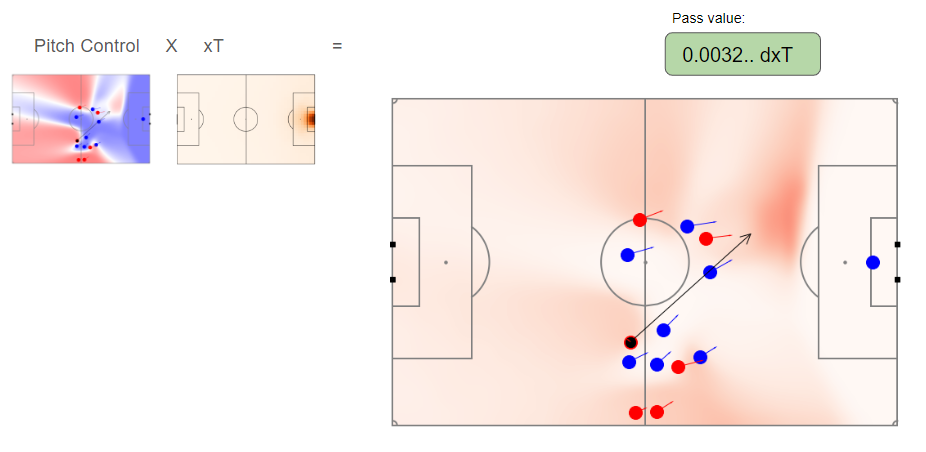
Figure 3: Heat map of adjusted xT by multiplying Pitch control with a positional xT model. The value of the pass is the difference between the adjusted xT at the start and end location of the pass
A player is said to have failed to mark his opponent if he is the closest defending player within a 5m radius (determined as the upper limit) of the receiver of the pass, at the moment of the pass.
The dxT conceded from failed marking metric punishes the player that failed to mark the receiver by assigning him a negative value corresponding to the dxT of the pass.
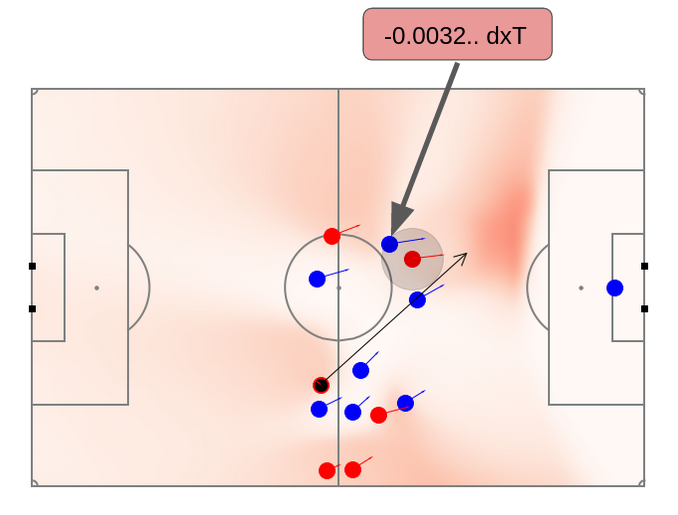
Figure 4: The closest defender within 5m is responsible for the failed marking and is assigned the negative dxT value of the successful pass.
Only value-adding dxT passes are considered, so the metric does not reward defending players that are close to the receiver of a value-decreasing pass.
The metric is adjusted by minutes played and possession since more defensive teams face more passes.
Results
Our metric was applied to all center backs that played over 900 minutes in the Premier League and summed over the season.
The resulting top 10 list is a combination of center backs from the top teams in the league and experienced mid-table players with the exception of Dara O’Shea, a young defender from the relegated WBA.
This stat seems to be dependent on the playing style of a team.
While most top teams in the Premier League are at the top of this possession-adjusted ranking, multiple players from Tottenham Hotspur are ranked close to the bottom despite the team finishing 7th in the league.
We conclude that our metric manages to capture a certain part of successful defending,
but acknowledge that there are other aspects of defending not measured by it.
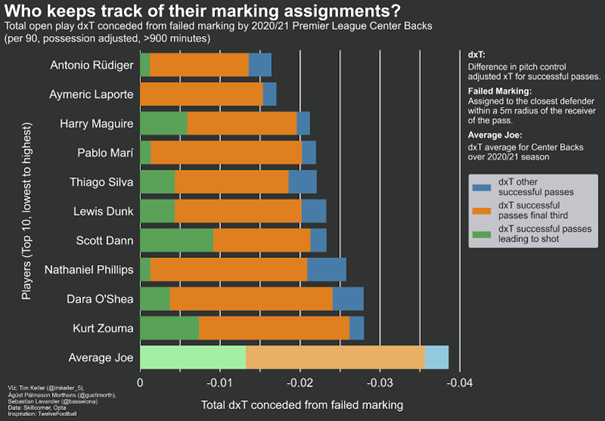
Figure 5: Top 10 center backs in the league in dxT conceded from failed marking that played over 900 minutes.
Discussion
In its current state, the metric is most applicable for evaluating central defenders in open-play situations.
To evaluate marking in set pieces major adjustments would be necessary.
Furthermore, players should not be compared across different positions because results vary a lot since some positions occupy more dangerous areas than others.
Lastly, by looking at it from the opposite point of view, finding attackers that regularly get away from assigned marking defenders might be possible.
References
Singh, Karun. 2018. “Introducing Expected Threat (xT).” https://karun.in/blog/expected-threat.html.
Spearman, William. 2018. “Beyond Expected Goals.” In Proceedings of the 12th Mit Sloan Sports Analytics Conference, 1–17.
This project was done as part of the Mathematical Modelling course at Uppsala University (fall semester 2022). We want to thank David Sumpter for giving us that opportunity. There are a lot of useful resources from the course publicly available: https://soccermatics.readthedocs.io/en/latest/
You can find all the contributors to this project on Twitter:
- Ágúst Pálmason Morthens: @gustimorth
- Sebastian Levander: @basselona
- Tim Keller: @imkeller_5
Schreibe einen Kommentar